
The biggest Obstacle Course Race of the year in AlUla, Saudi Arabia is less than a week away. Take a look at this Strava deep-dive to see how the top athletes have been training.
With the significant popularity of Strava these days. Many athletes are uploading most, if not all their training data onto the platform. For athletes with a public profile that anyone can view. We can take a peek behind what the top athletes in our OCR environment are doing and how they’re training. We can learn some general themes from their training. And apply general principles into our own plans.
Design, approach and limitations of this analysis.
Time Period: The time period used in this analysis was January 15th – February 18th, 2024.
We will not dig into theory and debates on volume builds and tapering before an ultra. But, at a high level, some think volume should decrease 2-4 weeks before a race if the athlete is doing high volume. Others have come against this view. Some say, that if an athlete needs this much tapering, their intensity and volume were too high to begin with. They see an appropriate taper starting 7-10 days prior to a race.
So, no matter what the athlete thinks, we chose to start on January 15th, 6 weeks before the race. We can see the athlete’s final build with their peak volume and maybe a last big effort. Followed by starting to taper. We do not use the data from the final week before the race. We expect all athletes to be tapering and to have a big decrease in volume by this time.
Again, athletes’ training plans and actions differ. They differ in their approach to volume, big efforts, tapering and cross-training. Through looking at a good sample size of athletes and going back these 6 weeks. We hope to filter out outliers in the data and provide accurate averages.

Athletes: The goal was to research and discuss training findings on 8-12 of the top men and 8-12 of the top women. Heading to AlUla for the Tough Mudder 8-hr Infinity race. Choosing the athletes is subjective in deciding who the top contenders may be. But, we chose 41 names to look up. Below, we outline the athletes we looked up.
- 8 of the 41 athletes did not have a public Strava profile.
- 13 of the 41 athletes had a profile but they either had no data or it wasn’t consistent enough to be used in this analysis.
- 20 of the 41 athletes had a public profile and consistent training logs. 16 male athletes and 4 female athletes. These athletes were used in the Strava review.
- Of the 20 athletes reviewed, 16 are running the solo 8-hr Infinity race and 4 are on a team.
- The 20 athletes come from the following countries: United States, Canada, Switzerland, Czech Republic, England, Germany, France and the Netherlands
Limitations: Our goal in this review is to show you useful information. How the top-level Obstacle Course Racing athletes are training for this race. However, because athletes were not talked to. And this analysis is based solely on what is being shown on the athletes Strava training log. There are a considerable number of unknowns, assumptions, limitations and considerations to be aware of. Some limitations are listed below.
- An Athlete may not be uploading all training relevant activities onto the Strava platform.
- We only know as much as the training activity tells us. Many athletes may not note further information about the activity which could be relevant. For example, if large breaks or time gaps are in a run, if a hike includes weight, if bicycling or running is completed immediately after a lower leg workout, what perceived exertion an activity was, what type of terrain was involved on a run, and so on.
- We are making the assumption that this Tough Mudder Infinity is an “A” race. It’s possible the athlete has other plans, and their training plan is focused elsewhere.
- We are unaware of the training plan duration each athlete has and it may not be based on a 7-day week. Our analysis is based primarily off the total timeframe of 5-weeks, so this should mostly be covered to represent any type of plan duration.
- We are unaware of any injuries these athletes may be dealing with, which could cause training volume that’s different than what they otherwise would be doing during this period of time leading up to a key race.
- 3 of the athletes have not consistently uploaded training data and their data is less than the full 5 weeks. Their volume and data were adjusted to reflect the appropriate time in creating the averages shown throughout.
Total Volume & Run Volume by Week
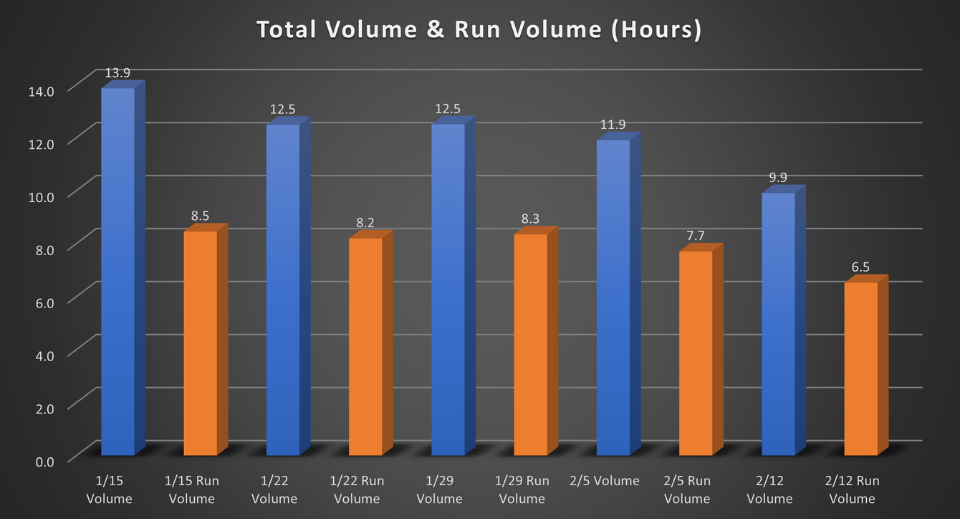
We collected the total training volume, run volume and cross-training volume. Coming from the 20 athletes from the time period mentioned leading up to the race. Refer to the following chart showing the athletes total volume and run volume over 5 weeks.
The chart shown is from 17 of the 20 athletes, as 3 of them didn’t have a full 5-week training log. As we would expect, training volume remains similar the first three weeks here and then we start seeing a slow decrease in the last two weeks. Additionally, take note in hours of training volume these top athletes are putting in. If you aim to enter the big leagues and compete with the top athletes in OCR or trail running. Be aware of the time commitment we see here.

Another note we will make that’s within this data. There are two high level trail runners we reviewed. The first began decreasing volume at least 4 weeks out at a very consistent level (2hr, 1.5hr, 1hr, 2.5hr decreases respectively). Going from 16.5 hours of run volume down to 9 hours in the last week reviewed. Even considering this decrease, the athlete still has a total running volume over these 5 weeks above and beyond the rest of the field. The second trail athlete we will mention performed a considerable amount of cross-training and skiing in the early weeks. Then started increasing running volume over the last 4 weeks, going from 2.5 hours in week 1 to over 9 hours of running in week 5. Two high level trail runners with very different approaches. But they are entering the race week with the same running volume. We felt this was interesting and worth mentioning.
Number of Runs Per Week & Average Duration
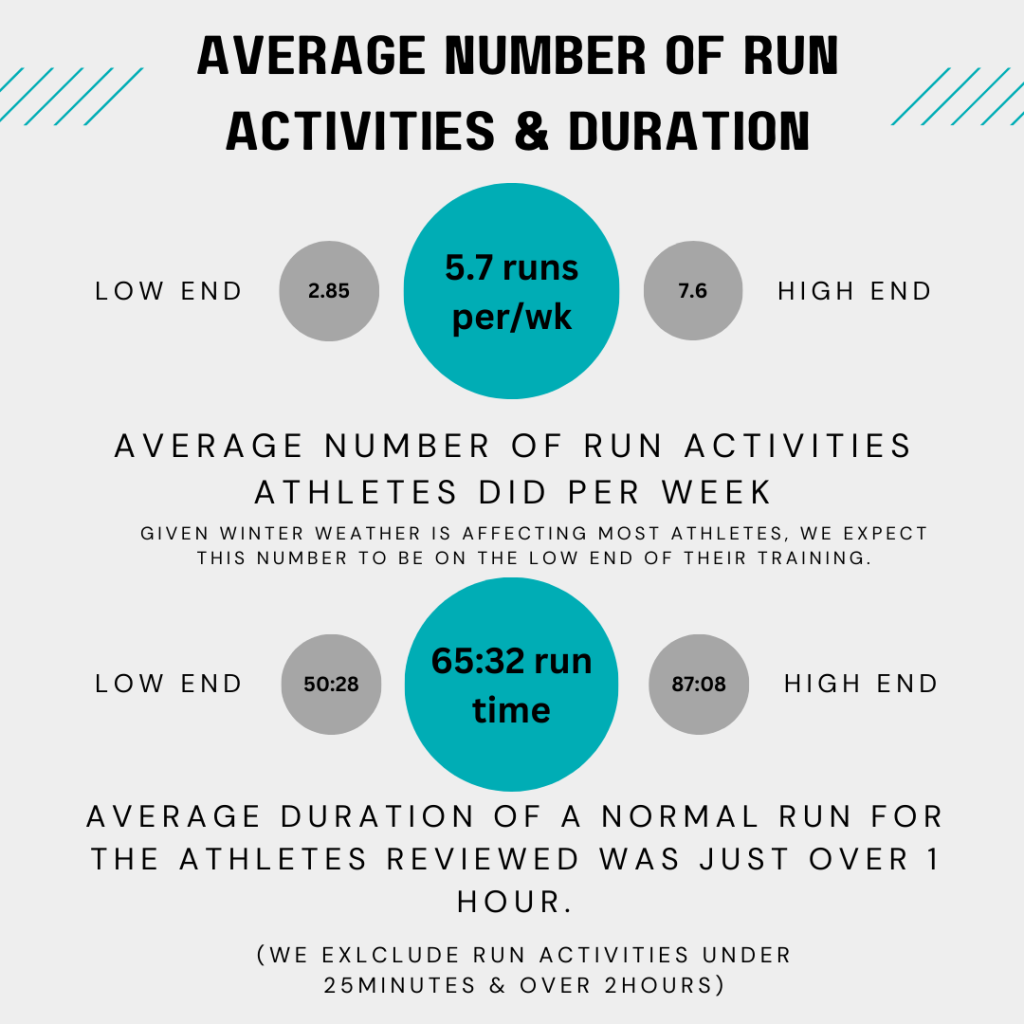
We wanted to look into two things with this data. FIRST, we wanted to find the average number of runs per week. Second, we wanted to find the average run duration. A chart below shows our findings. Note that we excluded all run activities below 25minutes. Sometimes an athlete will label it as a warmup or cool down, in which case we add it to their current run. If it wasn’t clear what the low volume activity was, we removed it from the analysis. Additionally, any long runs or big efforts are exceptions and were removed. This is subjective on what a long run or big effort is, but we went with 2-hours. All activities above 2-hours were removed for this analysis. What’s interesting is that we saw above that run volume did decrease over the last two weeks reviewed. But, the average number of runs and their average durations was very similar. In looking at athletes longer runs, it tends to be the 2-hour plus runs that caused the dip in the last two weeks. One last thing to note is that most of these athletes live in areas that are experiencing winter weather. Because of this, we would expect the average number of runs per week to be smaller than at other times of the year.
Full disclosure, the average runs per week broken into the 5 weeks starting with 1/15 was: 5.4, 5.9, 5.5, 5.3 and 5.5 respectively.
Full disclosure, the average minutes per run broken into the 5 weeks starting with 1/15 was: 66:40, 62:15, 65:20, 66:49 and 63:56 respectively.
The Long Run
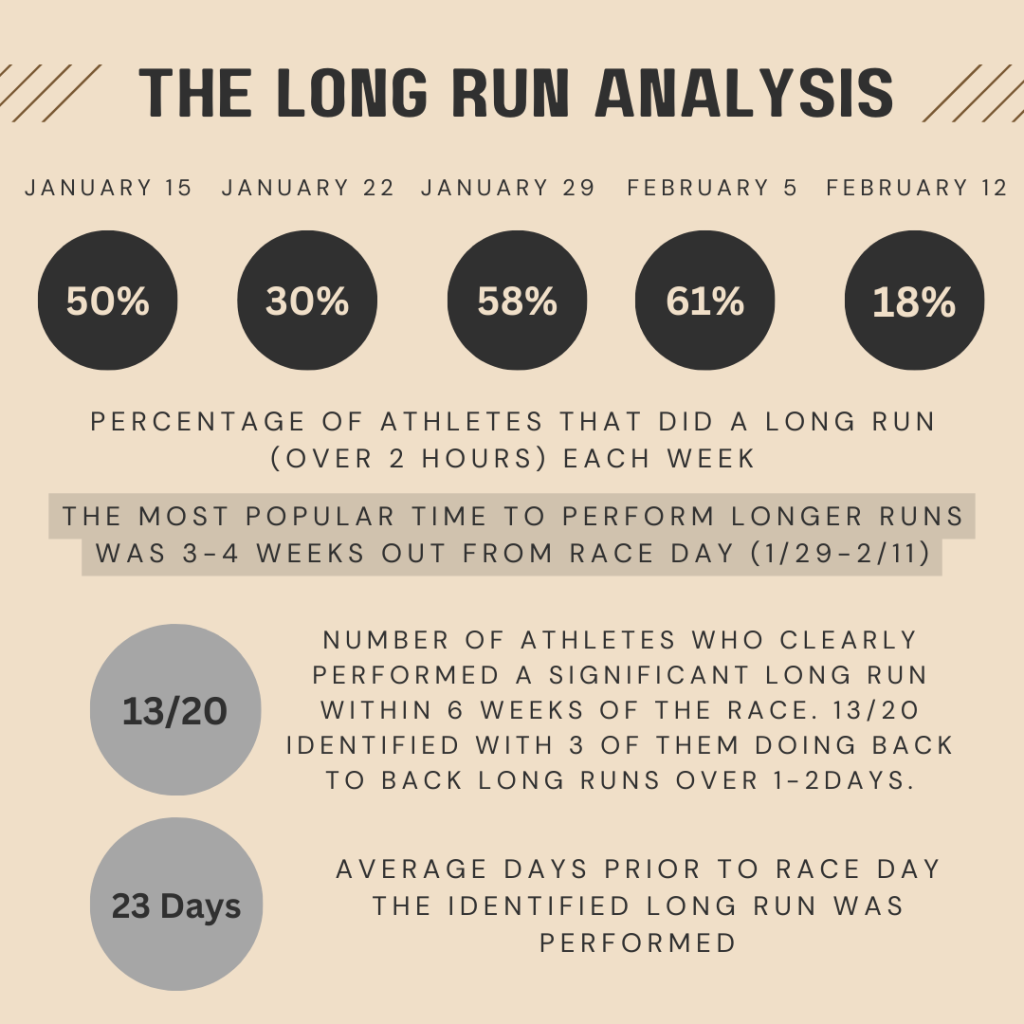
We reviewed long run efforts athletes performed over this time period. Again, subjective, but we are defining long run as any run activity above 2 hours. We found that 1 athlete never did a run above 2 hours, 3 athletes did 1 long run over these 5 weeks, and 5 athletes did 2 long runs. The average number of long runs during the 5 weeks was 3. On the higher end, we see 3 athletes with 5 long runs and 1 athlete with 10. The athlete with 10 is certainly an outlier. Over the 5 weeks this athlete did: 3, 2, 2, 3 and 0 long runs over the 5 weeks. We won’t remove this athlete as an exception. Instead, the chart below just shows the number of athletes who did a long run these weeks.
Additionally, we identified 13 athletes that did a significant long run over these 5 weeks. Three of which involved events 50-100K. Ranging from 4 to 11.5 hours. Four athletes performed back-to-back long runs with one doing it on the same day. Combined these were 4 to 7.5 hours. And the remaining 6 athletes doing noticeably longer runs between 3.5 to 5.5 hours over this time.
Further, there are three athletes that never hit a significantly long run or back-to-back long run but were close. These three were commonly putting in 2-3 larger efforts per week of 2 to 3 hour run activities. These three individuals had very consistent training and increasing volumes the first few weeks of the analysis. On a simpler level… they appear to know what they’re doing. They appear to have a training view of increasing volume but not throwing in a one-off “big” run that could have negative effects in the following days.

Other Training Activities
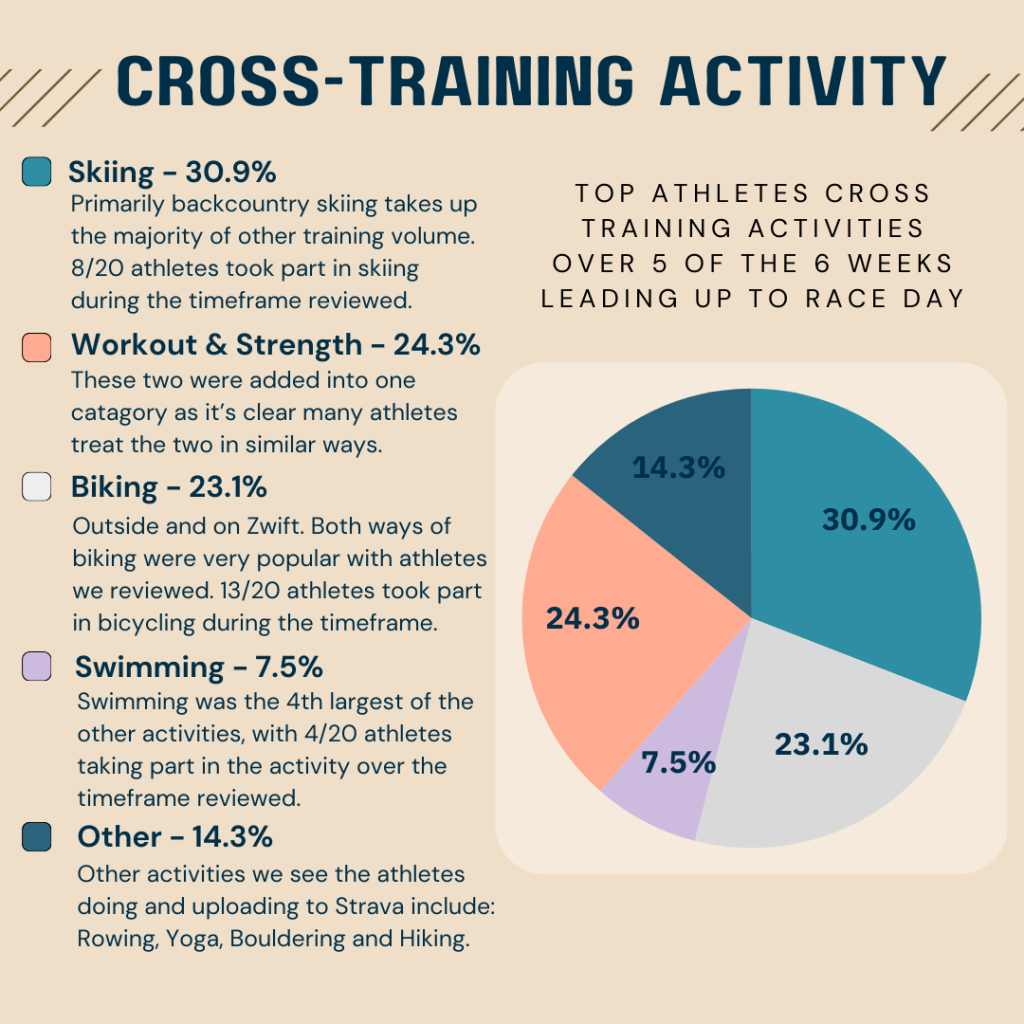
The athletes we reviewed often do cross-training activities. It can greatly affect their total volume. Refer to the pie chart below to get an idea of what other activities the athletes are taking part in. As mentioned before, most of these athletes are experiencing winter weather. So, we would expect that in the spring, summer and fall, the athletes run volume may be higher and cross-training lower.
We see that 40% of the athletes are doing Skiing. Nordic, backcountry and Alpine. Which took up the most volume. As these are long days out in the woods. Workouts and strength training existed, BUT, we do believe there are many athletes who don’t put this activity within their Strava training log. And even for the athletes that include it. It is difficult to pull out what was actually done and get a picture of how it affected the athlete. Biking was most common with 65% of athletes. The majority being done on a Zwift setup. Swimming was done by 20% of the athletes, at least one clearly being into triathlons. Other activities we saw primarily included yoga, hiking, rowing and bouldering. But we also saw snowboarding, ninja activities and rock climbing.
Common Themes Seen in the Data
If you are an athlete looking to move up into the top tier of obstacle course racing, take notes on these findings. Make sure your training matches some of these common themes we have seen. From running 6 days a week, adding cross-training activities to adding a long run effort 3 weeks prior to a race. Hopefully you found some good takeaways from this analysis. Use them in your own training for your next 8- or 12-hour Tough Mudder, Spartan Beast or Ultra or your next Trail race.
Let us know your thoughts. If you learned anything from this Strava deep dive and what you would like to see in the future.

Leave a Reply